As a CEO, how do you know the full story about your business's performance?
In this age of the Internet of Things, of Business Intelligence (BI), and Artificial Intelligence (AI), the information that's passed over to so many CEOs to illustrate the financial performance of their business is the standard accounting table. ‘Actuals v. Budget (and if they’re lucky, v. Last Year); for the Month and for the Year-to-Date.
The reason these tables are so commonly used is that they're the standard reports routinely churned out by accounting systems; but more significantly because it’s the way many people were taught to deliver the information - and they’re reluctant to change.
 the standard accounting table isn't enough
Now there are three massive shortcomings with this approach - and if you're a CEO you've probably experienced one or all of these.
First, the tables only compare how the business has performed 1) in a particular month and 2) over the period since the start of the year.
Second, the tables only compare the results against a budget; a budget that was a guesstimate at best when it was created, and has since been rendered pretty much useless by external factors beyond the control of the business.
And finally, they don't really convey information about the impact external factors are having on the performance of your business or on the industry generally.
What if the data that’s used to generate those standard accounting tables could be pulled out of the accounting systems and used in a different way?
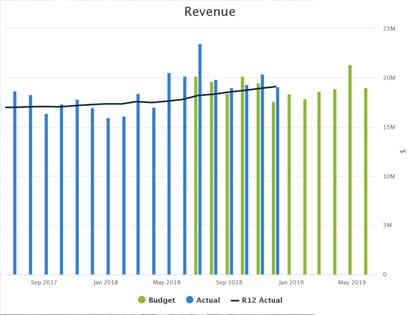
For example, how much more insightful would it be to display accounting data in charts showing a number of months of results against budget, if you must; and a rolling trend, to take out all the noise and seasonality? What if these charts gave you a clear and unequivocal picture of all the short, medium and long-term trends, in all parts of your business and at all levels? When working on strategic initiatives, information that helps businesses recognise when things have changed is a key factor in smarter and more timely strategic decision-making.
 charting a more accurate picture
How The Accounting Table Becomes a Tool For Improved Decision-making
To better understand financial performance it makes sense to also consider external market data. By factoring external trends into your charts you'll be building a truly visual story around the impact they're having on your business and your industry (think external opportunities and threats). Again, fully informed businesses that are responsive and adaptable to what’s going on in the world make better strategic decisions.
Tap Into The Stats!
By external data, we're talking about information readily available from organisations like the Australian Bureau of Statistics and the UK Office of National Statistics. Accessing this data is critical to businesses who want to succeed. There's a phenomenal amount of constantly updated external strategic information provided free of charge by government bodies and industry associations.
A Better Conversation
All this would make for a far more intelligent conversation with your board. Internal data has its part to play but CEOs can benefit from spending less time comparing performances against a guestimated budget and concentrating their efforts in considering their organisation's performance against prevailing industry conditions.